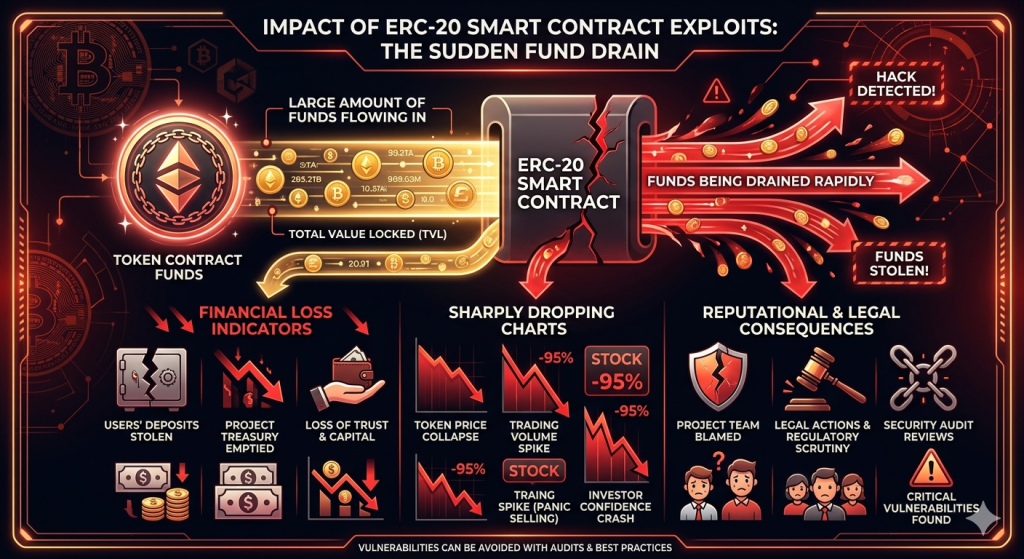
Blockchain networks generate thousands of transactions every single minute. Each transaction touches a smart contract, modifies state, or moves assets. If something malicious slips through unnoticed, the damage can be irreversible.
This is exactly why real-time blockchain threat monitoring has become a core pillar of Web3 security. It is no longer optional. It is foundational.
In this blog, we will walk through the full technical architecture behind API-based on-chain monitoring. We will cover node connections, event subscriptions, data pipelines, alert systems, and where smart contract security fits into all of this.
Why Real-Time On-Chain Monitoring Matters
Traditional security tools work on a polling model. They check for threats periodically. On-chain, that latency can cost millions.
Consider the Euler Finance hack in March 2023. About $197 million was drained in a single transaction. Post-incident analysis showed that the attack pattern was detectable in real time if proper monitoring had been in place.
Real-time monitoring solves this by reacting to events as they happen. It watches every block, every transaction, and every state change the moment it is confirmed.
Core Components of the Monitoring Architecture
Before writing a single line of code, you must understand what the system is made of.
The five core components are:
- Blockchain Node Connection – Your data source (full node, archive node, or managed RPC)
- Event Listener Layer – Subscribes to contract events and pending transactions
- Data Parsing Engine – Decodes raw on-chain data into readable formats
- Threat Detection Logic – Applies rules and heuristics to flag anomalies
- Alert and Response System – Notifies the team and triggers automated responses
Each layer feeds into the next. A failure at any point breaks the entire pipeline.
Step 1: Connecting to a Blockchain Node
Your monitoring system needs a reliable connection to the blockchain. You have three options.
Option A: Self-Hosted Full Node
This gives you full control. You run your own Ethereum or EVM-compatible node. The downside is maintenance overhead and significant hardware requirements.
bash
# Example: Starting a Geth node with WebSocket support
geth --mainnet \
     --ws \
     --ws.addr 0.0.0.0 \
     --ws.port 8546 \
     --ws.api eth,net,web3,txpool \
     --syncmode "snap"
Option B: Managed RPC Providers
Services like Alchemy, QuickNode, or Infura give you instant access. They handle uptime and scaling for you.
javascript
// Connecting via WebSocket using ethers.js
const { ethers } = require("ethers");

const provider = new ethers.WebSocketProvider(
  "wss://eth-mainnet.g.alchemy.com/v2/YOUR_API_KEY"
);

provider.on("block", async (blockNumber) => {
  console.log(`New block detected: ${blockNumber}`);
});
Option C: Multi-Provider Redundancy
For production-grade monitoring, use a failover setup. If one provider goes down, your system switches to a backup automatically.
javascript
const providers = [
  new ethers.WebSocketProvider("wss://provider-1.example.com"),
  new ethers.WebSocketProvider("wss://provider-2.example.com"),
];

const fallbackProvider = new ethers.FallbackProvider(providers, 1);
Always choose WebSocket over HTTP for real-time monitoring. WebSocket maintains a persistent connection. HTTP polling introduces unwanted latency.
Step 2: Setting Up Event Listeners
Smart contracts emit events when significant state changes occur. These events are your primary data feed for real-time monitoring.

Subscribing to a Specific Contract Event
javascript
// ABI snippet for an ERC-20 Transfer event
const ERC20_ABI = [
  "event Transfer(address indexed from, address indexed to, uint256 value)"
];

const tokenContract = new ethers.Contract(
  "0xYourTokenAddress",
  ERC20_ABI,
  provider
);

// Listen for all Transfer events in real time
tokenContract.on("Transfer", (from, to, value, event) => {
  const amount = ethers.formatUnits(value, 18);
  console.log(`Transfer detected: ${amount} tokens from ${from} to ${to}`);
  console.log(`Block: ${event.log.blockNumber}, TxHash: ${event.log.transactionHash}`);

  // Pass to threat detection engine
  analyzeThreat({ from, to, amount, event });
});
Monitoring the Mempool for Pending Transactions
The mempool contains transactions before they are confirmed. Monitoring it helps detect frontrunning, sandwich attacks, and large incoming transfers.
javascript
provider.on("pending", async (txHash) => {
  const tx = await provider.getTransaction(txHash);

  if (!tx) return;

  // Flag transactions with abnormally high gas prices
  if (tx.maxFeePerGas > ethers.parseUnits("500", "gwei")) {
    console.warn(`High gas transaction detected: ${txHash}`);
    flagForReview(tx);
  }
});
Listening to All Events from a Contract Address
Sometimes you want to catch everything. Use a wildcard filter for this.
javascript
// Listen to all events from a specific contract
const filter = {
  address: "0xYourContractAddress",
  fromBlock: "latest"
};

provider.on(filter, (log) => {
  console.log(`Event received from contract: `, log);
  parseEventLog(log);
});
Step 3: Parsing and Decoding On-Chain Data
Raw blockchain logs are encoded in ABI format. You need to decode them before you can apply any logic.
Using an Interface to Decode Logs
javascript
const iface = new ethers.Interface([
  "event Approval(address indexed owner, address indexed spender, uint256 value)",
  "event Transfer(address indexed from, address indexed to, uint256 value)",
  "event OwnershipTransferred(address indexed previousOwner, address indexed newOwner)"
]);

function parseEventLog(log) {
  try {
    const decoded = iface.parseLog({
      topics: log.topics,
      data: log.data
    });

    return {
      eventName: decoded.name,
      args: decoded.args,
      blockNumber: log.blockNumber,
      transactionHash: log.transactionHash
    };
  } catch (err) {
    console.error("Failed to decode log:", err.message);
    return null;
  }
}
Fetching Transaction Receipt for Context
The log alone is not enough. Pull the full receipt to understand the transaction context.
javascript
async function enrichTransactionData(txHash) {
  const [tx, receipt] = await Promise.all([
    provider.getTransaction(txHash),
    provider.getTransactionReceipt(txHash)
  ]);

  return {
    from: tx.from,
    to: tx.to,
    value: ethers.formatEther(tx.value),
    gasUsed: receipt.gasUsed.toString(),
    status: receipt.status === 1 ? "success" : "failed",
    logs: receipt.logs.map(parseEventLog).filter(Boolean)
  };
}
Step 4: Building Threat Detection Logic
This is the intelligence layer. Raw on-chain data is only useful when you apply rules to it.
Common Threat Patterns to Detect
Here is a practical set of detection rules you can implement from day one.
javascript
const THREAT_RULES = {

  // Rule 1: Flash loan detection
  FLASH_LOAN: {
    description: "Flash loan borrow and repay in same transaction",
    detect: (logs) => {
      const borrows = logs.filter(l => l.eventName === "FlashLoan");
      return borrows.length > 0;
    }
  },

  // Rule 2: Abnormally large transfer
  LARGE_TRANSFER: {
    description: "Transfer exceeds threshold",
    threshold: ethers.parseUnits("100000", 18), // 100k tokens
    detect: (event) => {
      return event.args.value > THREAT_RULES.LARGE_TRANSFER.threshold;
    }
  },

  // Rule 3: Ownership change detected
  OWNERSHIP_CHANGE: {
    description: "Contract ownership transferred",
    detect: (event) => {
      return event.eventName === "OwnershipTransferred";
    }
  },

  // Rule 4: Rapid repeated calls (potential reentrancy signal)
  HIGH_FREQUENCY: {
    description: "Same address called contract more than 10 times in one block",
    detect: (callerMap, address) => {
      return (callerMap[address] || 0) >= 10;
    }
  }
};

function analyzeThreat(parsedData) {
  const threats = [];

  if (THREAT_RULES.FLASH_LOAN.detect(parsedData.logs)) {
    threats.push({ rule: "FLASH_LOAN", severity: "HIGH" });
  }

  if (parsedData.logs.some(log =>
    log && THREAT_RULES.OWNERSHIP_CHANGE.detect(log)
  )) {
    threats.push({ rule: "OWNERSHIP_CHANGE", severity: "CRITICAL" });
  }

  if (threats.length > 0) {
    triggerAlert(threats, parsedData);
  }
}
Building a Block-Level Analysis Loop
Instead of waiting for individual events, scan each block holistically.
javascript
async function analyzeBlock(blockNumber) {
  const block = await provider.getBlock(blockNumber, true);
  const callerFrequency = {};

  for (const tx of block.prefetchedTransactions) {
    // Track call frequency per address
    callerFrequency[tx.from] = (callerFrequency[tx.from] || 0) + 1;

    // Flag high frequency callers
    if (THREAT_RULES.HIGH_FREQUENCY.detect(callerFrequency, tx.from)) {
      console.warn(`High frequency caller: ${tx.from} in block ${blockNumber}`);
    }
  }
}

provider.on("block", (blockNumber) => {
  analyzeBlock(blockNumber).catch(console.error);
});
Step 5: Alert System and Automated Response

Detection without response is just noise. Your alert system must be fast, clear, and actionable.
Multi-Channel Alert Dispatcher
javascript
const axios = require("axios");

async function triggerAlert(threats, txData) {
  const payload = {
    timestamp: new Date().toISOString(),
    txHash: txData.transactionHash,
    blockNumber: txData.blockNumber,
    threats: threats,
    from: txData.from,
    to: txData.to
  };

  // Send to Slack
  await axios.post(process.env.SLACK_WEBHOOK_URL, {
    text: `THREAT DETECTED`,
    attachments: [{
      color: "danger",
      fields: threats.map(t => ({
        title: t.rule,
        value: `Severity: ${t.severity} | Tx: ${txData.transactionHash}`,
        short: false
      }))
    }]
  });

  // Send to PagerDuty for critical alerts
  if (threats.some(t => t.severity === "CRITICAL")) {
    await axios.post("https://events.pagerduty.com/v2/enqueue", {
      routing_key: process.env.PAGERDUTY_KEY,
      event_action: "trigger",
      payload: {
        summary: `Critical blockchain threat: ${threats[0].rule}`,
        severity: "critical",
        source: "on-chain-monitor",
        custom_details: payload
      }
    });
  }

  // Log to your internal database
  await logThreatToDatabase(payload);
}
Automated Pause Response (for Protocol Owners)
If you control the contract and have a pause mechanism, automate it.
javascript
const { ethers } = require("ethers");

const GUARDIAN_PRIVATE_KEY = process.env.GUARDIAN_KEY;
const signer = new ethers.Wallet(GUARDIAN_PRIVATE_KEY, provider);

const PAUSABLE_ABI = ["function pause() external"];
const protocolContract = new ethers.Contract(
  "0xYourProtocolAddress",
  PAUSABLE_ABI,
  signer
);

async function emergencyPause(reason) {
  console.warn(`Initiating emergency pause. Reason: ${reason}`);

  const tx = await protocolContract.pause({
    gasLimit: 100000,
    maxFeePerGas: ethers.parseUnits("200", "gwei")
  });

  await tx.wait();
  console.log(`Protocol paused. TxHash: ${tx.hash}`);
}
Use this with care. Only trigger automated pauses for the most critical threat signatures.
Step 6: Handling Reconnects and Production Reliability
WebSocket connections drop. Nodes restart. Your monitoring system must survive these events.
javascript
function createMonitor(wsUrl, contractAddress, abi) {
  let provider;
  let contract;
  let reconnectAttempts = 0;
  const MAX_RETRIES = 10;

  function connect() {
    provider = new ethers.WebSocketProvider(wsUrl);
    contract = new ethers.Contract(contractAddress, abi, provider);

    provider.websocket.on("close", () => {
      console.warn("WebSocket connection closed. Reconnecting...");
      reconnect();
    });

    provider.websocket.on("error", (err) => {
      console.error("WebSocket error:", err.message);
      reconnect();
    });

    // Attach your event listeners
    attachListeners(contract);
    reconnectAttempts = 0;
    console.log("Monitoring connection established.");
  }

  function reconnect() {
    if (reconnectAttempts >= MAX_RETRIES) {
      console.error("Max reconnect attempts reached. Manual intervention needed.");
      sendCriticalAlert("Monitor disconnected. Manual check required.");
      return;
    }

    const delay = Math.min(1000 * 2 ** reconnectAttempts, 30000); // exponential backoff
    reconnectAttempts++;

    console.log(`Reconnecting in ${delay / 1000}s (attempt ${reconnectAttempts})...`);
    setTimeout(connect, delay);
  }

  connect();
}
This pattern uses exponential backoff. It avoids overwhelming the node with rapid reconnection attempts.
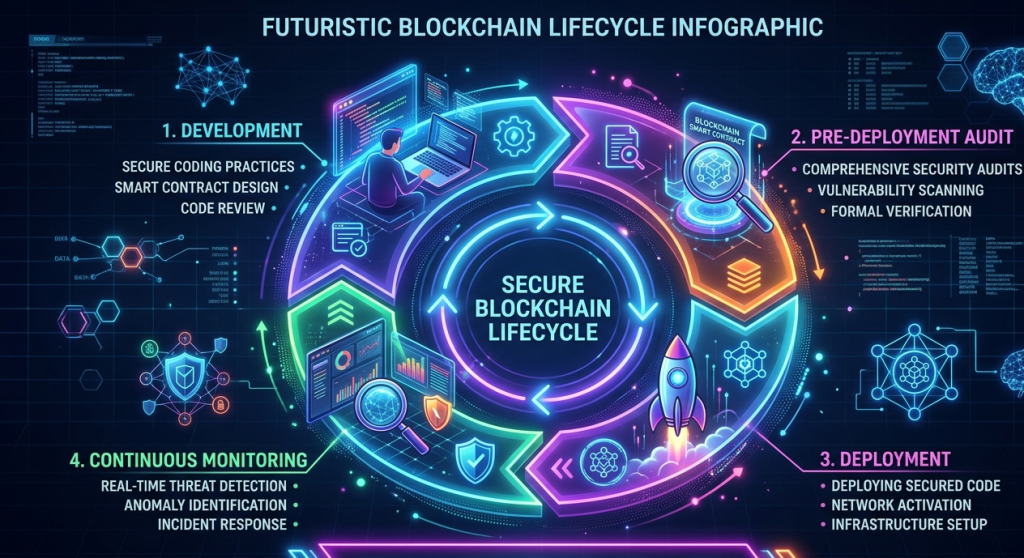
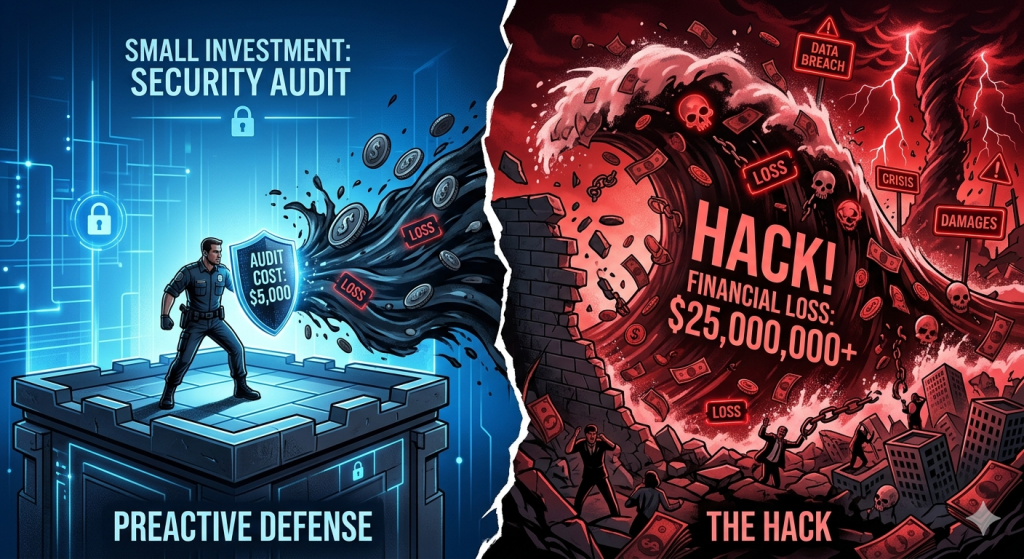
Integrating Smart Contract Security Before Deployment
All the monitoring in the world cannot fix a vulnerable contract. The best approach is to combine pre-deployment auditing with post-deployment monitoring.
Before you deploy any contract, a thorough smart contract audit should identify vulnerabilities in your code. Tools like SecuredApp’s smart contract auditing service analyse your Solidity code for reentrancy, integer overflows, access control flaws, and logic errors.
Once your contract is live, the monitoring architecture we have built above forms your second layer of defence. SecuredApp also provides ongoing smart contract monitoring capabilities that integrate with your deployed contracts. This gives you both static analysis at the code level and dynamic analysis at the transaction level.
The combination looks like this:
[Code Review + Audit] --> [Deployment] --> [Real-Time On-Chain Monitoring]
         ^                                              |
         |____________ Incident Response _______________|
Visit securedapp.io to explore audit and monitoring services built specifically for Web3 protocols.
Multi-Chain Monitoring Considerations
If your protocol operates across multiple chains, you need chain-specific configurations.
javascript
const CHAIN_CONFIGS = {
  ethereum: {
    rpcUrl: "wss://eth-mainnet.g.alchemy.com/v2/YOUR_KEY",
    chainId: 1,
    blockTime: 12
  },
  polygon: {
    rpcUrl: "wss://polygon-mainnet.g.alchemy.com/v2/YOUR_KEY",
    chainId: 137,
    blockTime: 2
  },
  arbitrum: {
    rpcUrl: "wss://arb-mainnet.g.alchemy.com/v2/YOUR_KEY",
    chainId: 42161,
    blockTime: 0.25
  }
};

// Start a monitor instance for each chain
Object.entries(CHAIN_CONFIGS).forEach(([chainName, config]) => {
  console.log(`Starting monitor for ${chainName}...`);
  createMonitor(
    config.rpcUrl,
    YOUR_CONTRACT_ADDRESS_ON_CHAIN,
    CONTRACT_ABI
  );
});
Note that Polygon and Arbitrum have much faster block times. Your processing pipeline must handle higher event volumes on these chains.
Data Storage and Historical Analysis
Real-time detection is critical. But historical data enables pattern recognition over time.
Store every alert and event in a structured format. A PostgreSQL or MongoDB setup works well for this.
javascript
const { Pool } = require("pg");

const db = new Pool({
  connectionString: process.env.DATABASE_URL
});

async function logThreatToDatabase(threatPayload) {
  await db.query(
    `INSERT INTO threat_logs
     (tx_hash, block_number, threat_type, severity, from_address, to_address, detected_at)
     VALUES ($1, $2, $3, $4, $5, $6, NOW())`,
    [
      threatPayload.txHash,
      threatPayload.blockNumber,
      threatPayload.threats[0].rule,
      threatPayload.threats[0].severity,
      threatPayload.from,
      threatPayload.to
    ]
  );
}
Query this database weekly. Look for patterns. Are the same addresses appearing repeatedly? Is a particular function being called in unusual ways? Historical data turns reactive monitoring into proactive threat intelligence.
Best Practices Summary
Implementing real-time blockchain threat monitoring correctly requires discipline. These practices matter:
Node and Connection Management Use WebSocket over HTTP always. Implement exponential backoff for reconnects. Run at least two provider instances in parallel for redundancy.
Event Handling Never block the event loop with synchronous processing. Use queues (like BullMQ or Redis) for heavy analysis tasks. Process events asynchronously and in parallel.
Threat Rules Start with a small set of high-confidence rules. Avoid false positives. A noisy alert system gets ignored. Tune thresholds based on historical data from your protocol.
Security of the Monitor Itself Your monitoring system holds keys if it can trigger pauses. Secure these keys with hardware security modules or secrets managers like AWS Secrets Manager. Never hardcode private keys.
Audit First, Monitor Always Deploy only audited contracts. Pair every deployment with active monitoring. SecuredApp’s services cover both ends of this requirement.
Frequently Asked Questions
It is a system that continuously watches on-chain activity and alerts teams when suspicious or malicious transactions are detected. It works by subscribing to blockchain events as they happen, rather than checking periodically.
WebSocket maintains a persistent, live connection to the node. It delivers new data instantly. HTTP polling sends repeated requests at intervals and misses events that occur between those intervals. For real-time monitoring, WebSocket is always preferred.
Yes. You create a separate provider instance and event listener for each chain. Each chain has its own RPC endpoint and block time. Your threat detection logic can be shared across all chain-specific listeners.
An audit checks the code for vulnerabilities before deployment. Monitoring watches the deployed contract for exploits after launch. Both are needed. An audit reduces risk at the source. Monitoring provides detection and response capability in production.
Start with conservative thresholds and a small number of high-confidence rules. Log everything but only alert on confirmed patterns. Review flagged events manually in the first few weeks. Use that data to calibrate your rules and reduce noise over time.